GA4 shows two hundred metrics and an operator needs about ten. The default reports were designed for analysts, and most business owners open them once, see "engaged sessions per active user", and never come back. A dashboard that gets read every Monday answers questions the business asks in the business's words: where do leads come from, which pages produce them, which language converts, and what changed since last month. This is how to build one, starting with the part everyone skips: the events.
Step 0. Define the events before the dashboard
A dashboard is a view of events. If the events do not exist, the dashboard is a view of page views, which tells you nothing about outcomes.
For a service business, the minimum set:
| Event | When it fires | Parameters |
|---|---|---|
generate_lead | Contact form submitted successfully | form_id, page_path, language, source_section |
whatsapp_click | WhatsApp link tapped | page_path, language, source_section |
phone_click | Phone link tapped | page_path, language, source_section |
email_click | Email link tapped | page_path, language |
offer_click | A priced package CTA tapped | offer_id, language |
view_item / view_item_list | A catalogue or service item is viewed (if there is one) | item_id, item_category, language |
Three rules that make this set useful:
- One event name per channel. A single
contact_clickwith achannelparameter forces you to mark "opened the map" as a conversion alongside "started a WhatsApp chat". Separate names let you mark the ones that are actually leads. - The language on every event. On a bilingual site where the primary language has no URL prefix, splitting by URL puts every unprefixed page into one bucket. An explicit
languageparameter is the only way to answer "does the Arabic site convert?". - One object describes the source. Where the click happened (hero, footer, service page CTA) and what it was about (which product, which offer) come from the same object that prefills the form. That way the analytics event and the lead record can never disagree.
Route everything through one data layer push so that a tag manager can add, rename or consent-gate events without touching the site. Then mark generate_lead, whatsapp_click and phone_click as key events in GA4.
Step 1. Choose the ten numbers
Each number answers a question the business asks. If you cannot write the question, drop the number.
| Question | Number | Source |
|---|---|---|
| How many enquiries did we get? | Leads (form + WhatsApp + phone), this month vs last | Key events |
| Where did they come from? | Leads by default channel group | Key events × session source |
| Which pages produce them? | Leads by landing page | Key events × landing page |
| Does the second language convert? | Leads and conversion rate by language | Key events × language |
| Which services get attention? | Views of service pages, ranked | Page views filtered to /services/ |
| Which offer gets clicked? | offer_click by offer_id | Event |
| Is search working? | Organic sessions and organic leads, trend | Channel = Organic Search |
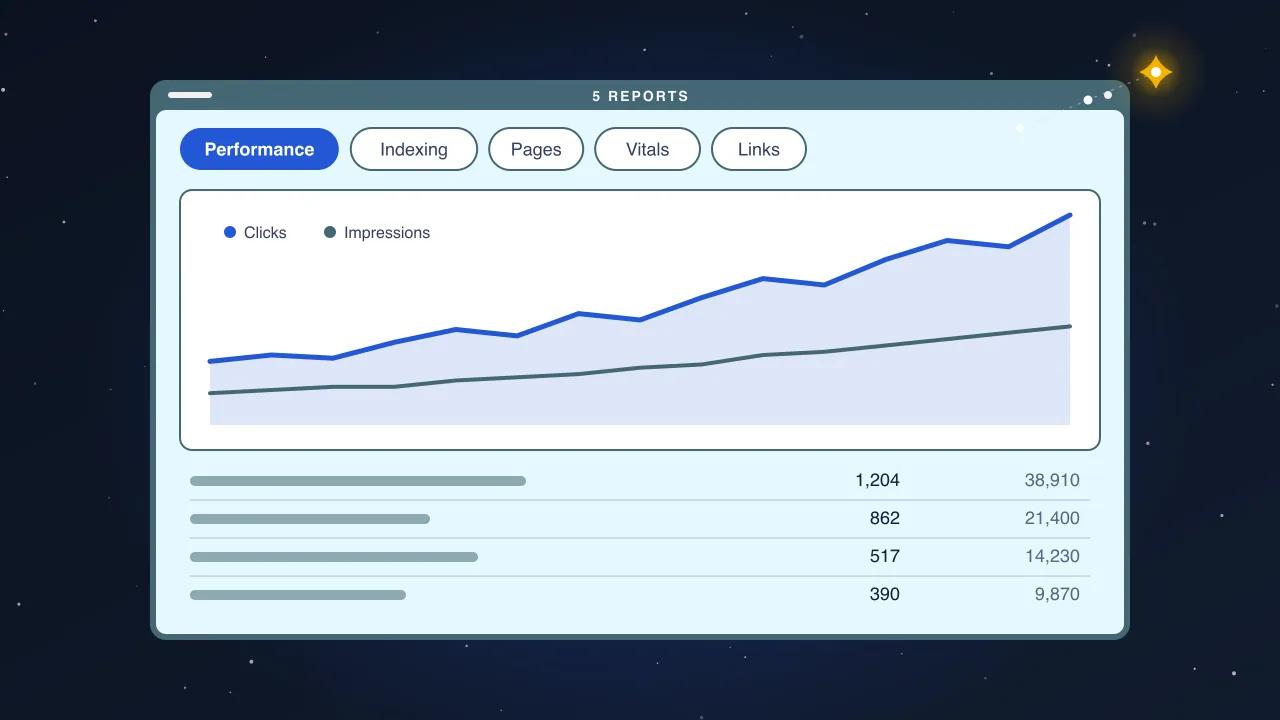
| Is the site fast enough? | Not from GA4: read the Search Console vitals report | External |
| Are visitors bouncing on mobile? | Engagement rate by device | Session dimension |
| What changed? | Month-on-month delta on the first four rows | Comparison |
That is the whole dashboard. Sessions and users are shown once, small, as context. They are never the headline.
Step 2. Lay it out as questions, one per row
Build it in Looker Studio (free, connects to GA4 natively) or GA4's own Explorations. Layout principles that keep it readable:
- One page. If it needs scrolling past the second screen, it has stopped being a dashboard.
- Row one is outcomes: leads this month, last month, and the delta, as three large numbers. Nothing else on that row.
- Row two is sources: a bar chart of leads by channel, and a table of leads by landing page. Both sorted descending.
- Row three is language: two columns, one per language, each with sessions, leads and conversion rate. This row is the one that decides content budget.
- Row four is attention: service page views ranked, and offer clicks by offer.
- Row five is context: organic trend line for twelve months, engagement rate by device.
- Date range fixed to "last month vs previous month" by default, with a control to change it. Nobody adjusts a date picker on a Monday morning.
Name every chart with the question it answers, not the metric it shows. "Where did leads come from?" not "Key events by session default channel group".
Step 3. Keep the definitions in the dashboard
Under each row, one line of small text saying what counts. "A lead is a successful form submission, a WhatsApp tap or a phone tap." "Language is the language the visitor was reading, not their browser setting." Six months from now someone will argue about a number, and the definition on the page settles it.
Step 4. Reconcile against the CRM monthly
GA4 counts browser events from visitors who allowed tracking. The CRM counts leads that exist. The gap comes from ad blockers, consent refusals, and forms that submitted but never fired the event. Expect a 10 to 30 percent gap. If it widens suddenly, the tag broke. If the CRM is the source of truth for the count, the dashboard's job is the mix and the trend, not the absolute.
Where the gap matters commercially, log leads server-side as well, at the moment the form handler succeeds. That count is immune to blockers and is the one to report.
Step 5. A Monday routine, ten minutes
- Read row one. Up, down, or flat, and by how much.
- Read row two. Did the mix change? A new channel appearing, or the organic bar shrinking, is the first sign of a problem elsewhere.
- Read row three. Which language earned its keep this month.
- Skim rows four and five. Anything surprising gets one sentence in the notes.
- Write three lines in a running document: the lead number, the biggest change, and the one thing to look at this week.
Twelve months of those three-line notes is a better record of the business's digital performance than any report an agency will send you.
What we build for clients
The measurement layer first: the event set above, through one data layer push, with the language on every event and one source object feeding both analytics and the form. Then the one-page dashboard with the ten numbers and the questions as titles. Then a monthly note comparing it to the CRM. The dashboard is not the deliverable; the Monday habit is.